The Direct Answer
Copying dashboard components from production SaaS tools saves hours of rebuilding. Instead of designing from scratch, you capture the HTML and CSS from existing dashboards (Azure DevOps, Salesforce, Power BI, etc.), then adapt them for your own projects. Azure DevOps lets you copy entire dashboards with all widgets intact, and the same principle applies to extracting individual components. Using a tool like Element Armory, you can capture any dashboard widget, layout, or data visualization in seconds and reuse it across your own admin panels, analytics platforms, or internal dashboards.
Why Copying Dashboard Components Saves Hours
Building dashboards from scratch is repetitive. You're not inventing new patterns-you're recreating layouts, cards, tables, and charts that already exist in production tools.
The reality: most dashboards follow the same structural patterns. A metrics card looks the same whether it's in Salesforce or your internal tool. A data table with sorting and filtering works the same way. A time-series chart is a time-series chart.
Many teams copy dashboards to test performance changes, create variations for different teams, or reuse designs across projects. The difference is that most teams do this manually, inspecting elements one by one in DevTools.
When you capture components systematically, you:
- Eliminate hours of CSS reconstruction
- Ensure visual consistency across projects
- Build a reusable component library faster
- Reduce design-to-code friction
The Problem with Manual Dashboard Rebuilding
Manual dashboard development creates friction at every step.
Step 1: Inspect the element You open DevTools, find the widget, and dig through the DOM tree.
Step 2: Copy styles You copy CSS from the Styles panel, but it's often incomplete. Styles are scattered across multiple files, some are minified, and computed styles don't always export cleanly.
Step 3: Rebuild the HTML You reconstruct the markup from memory or by copying fragments from the inspector. This is error-prone and time-consuming.
Step 4: Test and adjust You paste it into your project, realize spacing is off, colors don't match, and responsive behavior is broken. Back to DevTools.
Step 5: Repeat for every component A typical dashboard has 8-15 widgets. Multiply that by the number of dashboards you want to build, and you're looking at days of work.
Most dashboard gadgets can be configured in under 60 minutes, but that assumes you're starting with a template or existing component. Without one, you're starting from zero.
How to Capture Dashboard Components (Step-by-Step)
The fastest way is to use Element Armory to capture components directly from production dashboards.
Step 1: Install Element Armory Add the extension to your browser. It takes 30 seconds.
Step 2: Navigate to the dashboard Open any SaaS dashboard-Azure DevOps, Salesforce, Power BI, or your own internal tool.
Step 3: Click the component you want Hover over a widget, card, table, or chart. Click it with the Element Armory extension active.
Step 4: Capture the HTML and CSS The extension extracts the full HTML structure and all computed styles in one action. No manual copying. No incomplete CSS.
Step 5: Save to your library Store the captured component in your snippet library or export it directly to your project.
Step 6: Adapt for your use case Modify colors, spacing, or data bindings as needed. The hard part-the structure and styling-is already done.

Workflow: from production dashboard to reusable component in minutes.
Dashboard Patterns Worth Copying
Not all dashboard components are worth capturing. Focus on these high-value patterns:
Metrics cards A simple card showing a number, label, and trend indicator. Used everywhere. Capture once, reuse 50 times.
Data tables with sorting and filtering Tables are complex. Capturing a working table with proper styling saves hours of CSS debugging.
Time-series charts Line charts, bar charts, and area charts with axes, legends, and tooltips. The markup is dense; the styling is intricate.
Status indicators and badges Small components with high reuse value. Capture a set of status badges (success, warning, error, pending) and you have a pattern library.
Header and navigation layouts Dashboard headers often include breadcrumbs, filters, and action buttons. Capturing the layout structure saves time on every new dashboard.
Sidebar navigation Vertical navigation with icons, labels, and active states. Capture it once, adapt the links.
Modal and dialog patterns Modals for confirmations, forms, or detail views. The structure is consistent; only the content changes.
Using Captured Components with AI Coding Tools
Captured components become even more powerful when paired with AI coding tools like Cursor or Claude.
Instead of describing what you want to build, you can show the AI the actual HTML and CSS:
Workflow:
- Capture a dashboard component from production
- Paste the HTML and CSS into Cursor or Claude
- Ask the AI to adapt it: "Change the color scheme to match our brand" or "Add a loading state" or "Make it responsive for mobile"
- The AI understands the structure and makes surgical changes instead of guessing
This is faster than writing detailed prompts. The AI sees the real code and can reason about it directly.
Salesforce allows copying and pasting widgets across dashboards, and the same principle applies here: once you have the component code, adaptation is straightforward.
Adapting SaaS Dashboard Layouts for Your Project
Captured components rarely work as-is. You'll need to adapt them.
Color and branding Replace the original color palette with your brand colors. This is usually a find-and-replace operation on CSS variables or hex codes.
Data binding The captured component has placeholder data or hardcoded values. Swap in your own data source. If it's React, bind to props. If it's vanilla HTML, add JavaScript event listeners.
Responsive behavior Test the component on mobile. Most SaaS dashboards are built for desktop. You may need to adjust breakpoints or hide certain elements on smaller screens.
Accessibility Ensure the component meets your accessibility standards. Add ARIA labels, keyboard navigation, and focus states if they're missing.
Performance If the component includes heavy JavaScript or large images, optimize it for your use case. Remove unused features.
Integration Connect the component to your backend. Replace API endpoints, authentication tokens, and data transformations.
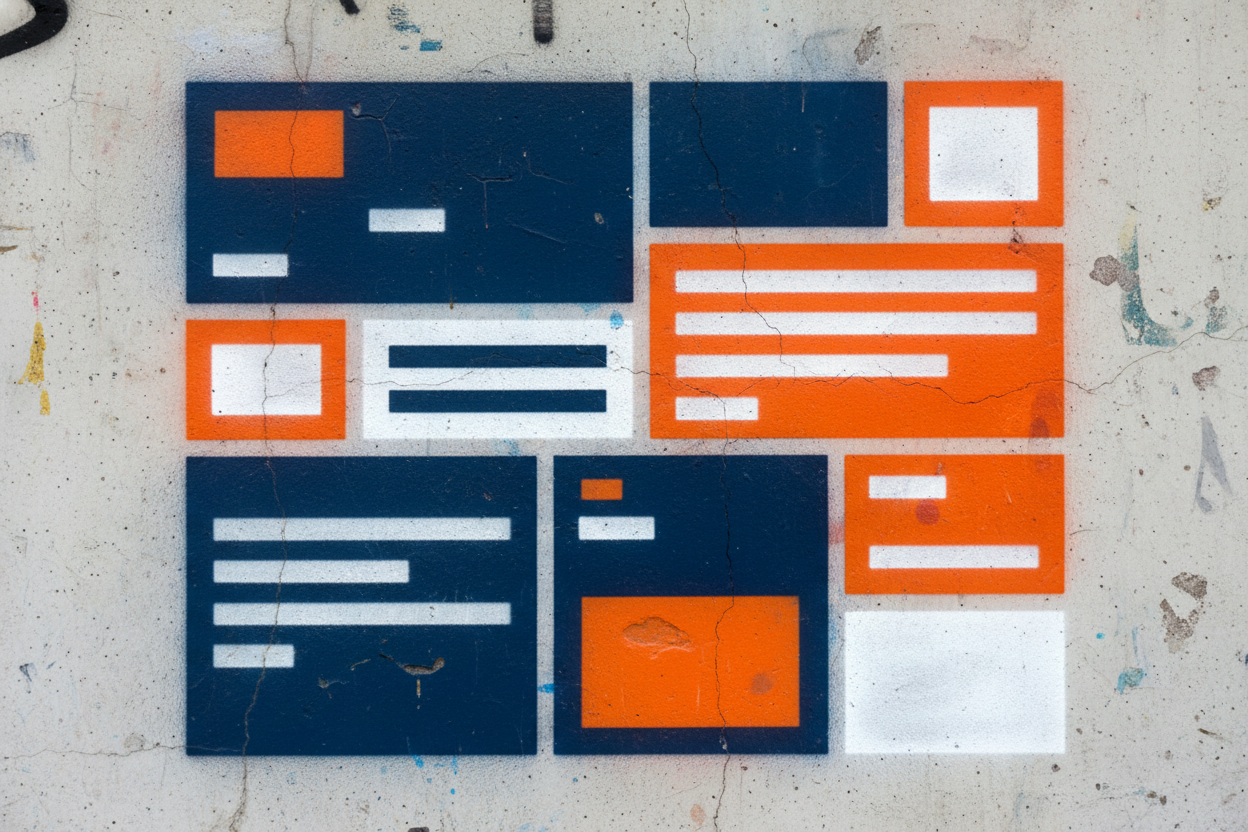
Common Dashboard Components to Extract
Here are the components that appear most frequently across SaaS tools and are worth capturing:

High-value components found in most production dashboards.
Building a Reusable Dashboard Component Library
Once you've captured a few components, organize them into a library.
Structure your library:
/components
  /cards
    - metric-card.html
    - status-card.html
  /tables
    - data-table.html
    - sortable-table.html
  /charts
    - line-chart.html
    - bar-chart.html
  /navigation
    - sidebar.html
    - header.html
  /modals
    - confirmation-modal.html
    - form-modal.html
Document each component:
- What it does
- Where it came from (source dashboard)
- How to customize it
- Dependencies (libraries, data structure)
Version your components: As you refine them, keep track of changes. This prevents breaking existing dashboards when you update a component.
Test across projects: Use each component in at least two projects before considering it "stable." This catches edge cases and reveals what customization is actually needed.
Best Practices for Dashboard Component Reuse
1. Capture at the right granularity Don't capture entire dashboards. Capture individual widgets and small layout patterns. This gives you flexibility.
2. Remove hardcoded data Before saving a component, strip out hardcoded values. Replace them with placeholders or data bindings.
3. Preserve semantic HTML When adapting components, keep the HTML structure clean. Don't add unnecessary divs or classes.
4. Document the source Note where each component came from. This helps you find the original if you need to reference it later.
5. Test before reusing Don't assume a captured component will work in your project. Test it with your data, your styling, and your browser support requirements.
6. Keep a changelog When you modify a component, document what changed and why. This prevents confusion when multiple versions exist.
7. Automate where possible If you're capturing many components, consider scripting the process. Element Armory can be integrated into workflows to batch-capture components.
Comparison: Manual vs. Automated Component Capture
| Aspect | Manual DevTools | Element Armory |
|---|---|---|
| Time per component | 15-30 minutes | 30 seconds |
| Completeness | Partial (often missing styles) | Complete (HTML + computed CSS) |
| Reusability | Low (requires cleanup) | High (ready to use) |
| Consistency | Variable (depends on inspector skill) | Consistent (automated extraction) |
| AI-friendly | Requires manual formatting | Direct paste into AI tools |
| Batch capture | Not practical | Possible with automation |
Getting Started Today
The fastest way to build dashboards is to stop building from scratch. Start capturing components from production tools you already use.
Pick one dashboard you admire-Azure DevOps, Salesforce, Power BI, or any internal tool. Identify 3-5 components you want to reuse. Capture them. Adapt them. Build your first dashboard 10x faster.
Your component library grows with every project. Over time, you'll have a rich set of patterns that work for your team, your brand, and your use cases.
The best dashboard is one you didn't have to design.